Toyota: a case study
Oct 30, 2014
710 likes | 2.16k Views
Toyota: a case study. Background. Toyota Motor Company was founded in 1937 by the Toyoda family. Business was relatively unsuccessful until Eiji Toyoda introduced the method of lean production after studying Ford’s Rouge plant in Detroit in 1950.

Share Presentation
- lean production
- production system
- product development
- lean production method
- production smoothing enables suppliers

Presentation Transcript
Background • Toyota Motor Company was founded in 1937 by the Toyoda family. • Business was relatively unsuccessful until Eiji Toyoda introduced the method of lean production after studying Ford’s Rouge plant in Detroit in 1950. • This lean production method became known as the Toyota Production System. • The production executive, Taiichi Ohno, successfully helped Toyoda improve his company using this new production method and mode of thinking.
Environment • Cultural • Company as a community: lifetime employment, access to company facilities, seniority-based wages (in return for 1/3 work force layoff in 1946) ; as a return, employees must be more flexible and actively promote interests of company >> Implications: labor = Fixed cost • Economic • Postwar conditions put Japan into a country lacking significant capital, so that Japan had to rely mostly on producing its own technology. • Political • The Ministry of Int’l Trade and Industry (MITI) encouraged Japanese firms to enter the automobile industry despite established competitors from the West by imposing high tariffs discouraging imports and prohibiting foreign ownership. • Japan’s work force, under Western influence after WWII, grew more powerful and more demanding, thus limiting producers’ efforts to reduce labor costs.
Environment (cont.) • Demographical • The domestic market was very small and un-uniform. Thus, goods had to be very tailored to specific consumer taste. E.g. luxury cars for officials, small cars for city residents, etc. • Technological • Commitment to innovation and improvement • Large skilled-labor pool to draw from • Social • Commitment by employees to work
Country Differences? • Western “careers” vs. Japanese “community” • Focus on long-term growth as opposed to short-term profits • More interpersonal relationships with employees, suppliers, and customers
Organizational Structure • Multi-regional lean enterprise • Primarily network structure • Network of suppliers • Network of dealers/distributors • Frequent interaction between all levels of the organization
Strategy – Lean Production • Final assembly plant • Moved from “move the metal” mentality to kaizen • Introduced idea of stopping assembly lines in order to correct problems before continuing • As a result, quality improved and yields are close to 100% • Product development and engineering • Focused on leaders that knew all steps of a process rather than those with highly specialized knowledge; also, skill-building • More emphasis on proactive thinking by employees • Thus, increased productivity, product quality, and responsiveness to changing consumer demand • “quality circles”
Lean Production – in more detail • 2 organizational features: • “Transfer max number of task and responsibilities to those workers actually adding value to the car on the line” • “has in place a system for detecting defects that quickly traces every problem, once discovered, to its ultimate cause” • Thus, need tight teamwork and open communication among workers (comprehensive info display system on electronic displays visible from all work areas) • 4 areas of importance: • Leadership: Toyota’s large-project leader w/power vs. Western coordinator • Teamwork: from many functions, ties with department, and general interest in promoting team, not department • Communication: conflicts resolved in beginning, more people => less people • Simultaneous Development
Competitive Advantages • Reliability • Product variety • Production plants in North America build 2-3 products at a time, as opposed to one by Western firms. • Firms keep models for an average of four years, as opposed to an average of close to ten years by Western companies. • Western companies sell almost twice as many cars of the same model as Japanese firms do.
Suppliers – Lean Production Supply Chain • Organized suppliers into functional tiers • First-tier suppliers: worked together in a product-development team • Second-tier: made individual parts • Encouraged cooperation and communication among first-tier suppliers • In –house supply operations turned into a network of “quasi-independent first-tier supplier companies” • Substantial cross-holdings between Toyota and suppliers, as well as among suppliers themselves even though each supplier is an independent company • Cross- sharing of personnel through • Toyota sending personnel to suppliers to compensate for greater workload • Toyota transferring senior managers to suppliers for top positions • Developed the “just-in-time” (JIT) system, or kanban
Suppliers – Lean Production Supply Chain (cont.) • “market price minus” system, not “supplier cost plus” system • Value analysis reduces costs • Declining prices over life of model due to learning curve • Production smoothing enables suppliers to maintain a constant volume of business • Focus is on long-term relationships that underscores cooperation, teamwork, and gradual mutual improvement, rather than price through bidding as a way to choose a supplier
Consumers • The market began to fragment in the 1960s as cars increased in popularity and became essential household goods. • Marketing executive Shotaro Kamiya focused on building a sales network modeled after Toyota’s supplier network. • Distributors with a “shared destiny”: wholly owned companies or ones in which Toyota held equity • “aggressive selling”: promoted long-term relationship between assembler, dealer, and buyers • Dealer => production system => build-to-order system • Buyers => product development process • Direct calls to households with large database of households and buying preferences • Focus on repeat buyers • Also focus on brand loyalty => “Toyota family” • 5 distribution channels in Japan: Toyota, Toyopet, Auto, Vista, and Corolla • Closer and more familiar relationship between buyer and salesperson • Focus on customer-specified order
Marketing • Door-to-door selling/very customized • Emphasis on “pull” marketing: giving consumers what they want • Tight relationship with previous buyers to keep clients • Sales personnel received intensive training before starting their jobs • Up-to-date and detailed database of consumers helps keep track of trends, interests, and tastes
Competitors • American companies upon which Toyota originally developed many of its own production processes from • GM • Ford • Etc. • Korean companies with planned production • Other Japanese companies, especially Nissan and Honda
Problem • Obstacle: inward focus of Japanese lean producers • Lack the ability to think and act globally rather than from a narrow national perspective • Backlash to Japanese direct investment in North American and Europe, a prominent reason of which is that it creates friction as a result of Japanese corporation biases, mainly two classes of citizenship in their organizations • E.g. keiretsu
Possible Solutions • Appoint native managers to head their manufacturing operations in North America and Europe • Designate native supplier companies as source for certain categories of components • Governments: restrictions on visas for Japanese employees at new facilities and in Europe, strong pressures to attain high levels of domestic content asap • Author suggests: build a truly global personnel system in which new workers from North America, Europe, etc. where a company has design, engineering, and production facilities, are hired in at an early age and given the skills, including language and exposure to management in different regions, needed to become full citizens of the company • Same for suppliers • Need increased transparency
Conclusion – Watch for quality • fear of repetition of Ford’s experience in Britain after 1915 • Wholesale substitution of domestic managers and suppliers, to deal with investment friction, will degrade performance of production system toward the existing level • Evidence that plants that perform best are those with very strong Japanese mgmt presence in early years of operations and those that have moved slowly and methodically to build up their domestic supply base • Need managers and suppliers that understand lean production and are committed to it, mostly Japanese
Financial figures • In fiscal 2003, ended March 31, 2003, Toyota’s consolidated net revenues increased 9.2%, to ¥15.50 trillion, operating income rose 16.3%, to ¥1.27 trillion, and net income was up 34.9%, to ¥750.9 • ROE reached 10.4%, surpassing the short-term target of 10%. • As of March 31, 2003, treasury stock repurchased by the Company totaled ¥1.38 trillion, or 416 million shares, and total shares issued and outstanding—excluding treasury stock—had decreased to 3.45 billion shares. • In fiscal 2003, the Company paid its highest-ever annual dividend—¥36.00 per share, up ¥8.00 from the previous fiscal year.
- More by User

Chapter 5 Case Study: MVC Architecture for Web Applications
Chapter 5 Case Study: MVC Architecture for Web Applications Objectives of This Chapter Overview MVC Basics JDBC A Case Study: On-Line Shopping Application Introduce concepts of MVC design architecture Demonstrate the Java implementation of MVC architecture
1.67k views • 91 slides
Mutualism and Commensalism
Mutualism and Commensalism. 14 Mutualism and Commensalism. Case Study: The First Farmers Positive Interactions Characteristics of Mutualism Ecological Consequences Case Study Revisited Connections in Nature : From Mandibles to Nutrient Cycling. Case Study: The First Farmers.
2.06k views • 45 slides

Nationalisation: A case study of Zambia
Nationalisation: A case study of Zambia. By Ndangwa Noyoo Rhodes University Summer School 13 September 2011. Introduction.
1.22k views • 40 slides

Case Study Analysis
Case Study Analysis. Karen Pelletier Geneice Bassue Lee Dubois James Lowe. History of the Company. Incorporated in 1998 in Delaware, commenced service in 2000 - primary base of operations at JFK in New York.
2.75k views • 30 slides

Water Quality
Water Quality. Intro by Erick Bjorkland Chesapeake Bay Case Study Brandon Powers Created Wetlands by Carol Ann Dulin Saltwater Case Study by Meghan Barron. Clean Water Act.
1.3k views • 75 slides

Case Study Research Manufacturing and Technology Management Research Methodology Workshop 2008
Case Study Research. Outline. What is a case?Why case study research?Designing case studiesExample 1: changes in the spatial organization of high growth start-upsExample 2: the decline of the Cambridgeshire high-tech clusterSummary. Case Study Research. What is a case?. Case Study Research. What is a case?.
1.58k views • 32 slides

The Toyota Recall Crisis: Causes, Contexts, and the Impact on the Global Auto Industry
The Toyota Recall Crisis: Causes, Contexts, and the Impact on the Global Auto Industry. Dr. Jun Zhao Associate Professor of Management College of Business and Public Administration Governors State University Presented at the 30 th IASET Annual Spring conference. The Toyota Recall Crisis.
1.02k views • 21 slides
Study Case : Walt Disney’s & Dennis Hightower
Study Case : Walt Disney’s & Dennis Hightower. Buku : Managing Change; Case & Concept, Todd D. Jick, McGraw Hill, second edition, p.366 - 378. Disney’s Organization. Founded in 1923 by Disney brothers, Walt and Roy, with $500 loan, and had grown by 1987 into an entertainment industry.
2.33k views • 11 slides
The Toyota Production System
The Toyota Production System. Japanese 101. Why study Toyota?. Total annual profit on March 2003 was $8.23 billion- larger than combined earnings of GM, Chrysler and Ford. Profit margin is 8.3 times higher than industry average.
4.68k views • 46 slides

HUD RHIIP Training – PH/HCV
HUD RHIIP Training – PH/HCV. Case Study 3 – Champion Family (Housing Choice Voucher). Champion Case Study:. Same process as Alexander and Bennett Topic presentation Students complete case study Using Appendix C, File Review Checklist Worksheets Students review PHA’s HUD 50058
1.46k views • 94 slides

Nestle Case Study
Nestle Case Study. Group 8: Sohum Mehta, Johannes Matthias, Rahil Poojara, Austin Cunningham, Xiaoya Li. Largest nutrition and foods company in the world Founded and headquarterd in Vevey, Switzerland
2.95k views • 22 slides

NIC Exposure Level Training
NIC Exposure Level Training. Vijayendra Gururao Business Intelligence Consultant. Agenda. Data warehousing Concepts - Day 1 Govt Case Study - Day 2 Defense HR Case study - Day 3 Manufacturing Case Study - Day 4 Data mining - Day 5. What to do about it . 2001. Active. Act.
1.64k views • 139 slides

Case Study Research: Developmental Research
Case Study. What comes to your mind when you hear case study"?. Camila is responsible for . P.21-32Introducing case study researchExperiencing case study researchCompiling case study researchAnalyzing case study researchReporting your results. Ariel is responsible for. Designing case study re
1.48k views • 36 slides

Case Study Congestive Heart Failure
Case Study Congestive Heart Failure. By: Ellinor Lagerberg. Reason for study. Gain knowledge about CHF (congestive heart failure) and its etiology. To understand how nutrition education is applied in acute care for patients with CHF.
7.65k views • 36 slides

Schizophrenia
Schizophrenia. Unfolding Case Study By Amanda Eymard , DNS, RN and Linda Manfrin-Ledet , DNS, APRN. Assigned Reading to be completed prior to case study. Prior to conducting this unfolding case study, students should read the following:
4.3k views • 82 slides
Social Research Methods
Social Research Methods. Case Studies. What is a Case Study?. “ A strategy for doing research which involves an empirical investigation of a particular contemporary phenomenon within its real life context using multiple sources of evidence ” (Robson, 1993, p. 146) A Case Study may be…
1.62k views • 14 slides

Chapter 5 Case Study: MVC Architecture for Web Applications. Objectives of This Chapter. Overview MVC Basics JDBC A Case Study: On-Line Shopping Application Introduce concepts of MVC design architecture Demonstrate the Java implementation of MVC architecture
1.25k views • 91 slides
Randomized Controlled Trial
Randomized Controlled Trial. Subodh S Gupta Dr. Sushila Nayar School of Public Health MGIMS, Sewagram. Progression of Study Design: Clinical Research. Isolated Case Reports Case Series Cross-Sectional study Case-Control Study Cohort Study Randomized Clinical Trial Meta-Analysis
1.74k views • 83 slides

TOYOTA BUSINESS PRACTICES Overview
TOYOTA BUSINESS PRACTICES Overview. Outcome of TBP. TBP Provides Growth & Satisfaction. TOYOTA. Toyota Members. Business Partners. Combining our efforts and attaining mutual growth. Mutual trust through successful business. Achieving greater challenges Sharing the accomplishments
5.26k views • 59 slides


Case study research
Case study research. Marie-Louise Barry. Use of different strategies.
1.77k views • 79 slides

adidas Case Study
adidas Case Study. By: Ray Moorman Dan McLinden Tom Anderson Kyle McDaniel Jeremy Smiley. Primary Question for adidas.
4.4k views • 37 slides

- My presentations
Auth with social network:
Download presentation
We think you have liked this presentation. If you wish to download it, please recommend it to your friends in any social system. Share buttons are a little bit lower. Thank you!
Presentation is loading. Please wait.
To view this video please enable JavaScript, and consider upgrading to a web browser that supports HTML5 video
A CASE STUDY ON TOYOTA PRODUCTION SYSTEM
Published by Gyles Hicks Modified over 8 years ago
Similar presentations
Presentation on theme: "A CASE STUDY ON TOYOTA PRODUCTION SYSTEM"— Presentation transcript:

Presented by Art Smalley President Art of Lean, Inc.

Lean Supply Chains Chapter Fourteen McGraw-Hill/Irwin

Fundamentals of Operations Management 4e© The McGraw-Hill Companies, Inc., –1 Managerial Issues Using JIT as a tool for controlling the flow of materials,

JIT, TPS, and Lean Operations

Chapter 3 Planning for Production. Objectives Product oriented manufacturing systems versus people oriented manufacturing systems. Manufacturing smaller.

Toyota’s lean management Harel cohen Maxim shulman.

Just-in-Time and Lean Systems

Operations Management Just-in-Time Systems Supplement 12

JIT/Lean Production. ©2006 Pearson Prentice Hall — Introduction to Operations and Supply Chain Management — Bozarth & Handfield Chapter 15, Slide 2 Some.

Chapter 16 - Lean Systems Focus on operations strategy, process, technology, quality, capacity, layout, supply chains, and inventory. Operations systems.

JIT and Lean Operations. MRP (push) and JIT (pull) system PULL SYSTEM PUSH SYSTEM A PUSH system where material is moved on to the next stage as soon as.

JIT/Lean Production Chapter 13.

Benefits of Lean Manufacturing: To benefit from Lean Manufacturing, the processes must be maintained consistently and correctly. Everyone involved must.

The Value of Lean Thinking Presented by: Brian D Krichbaum Process Coaching Incorporated.

Lean for Process Manufacturing QAD Midwest User Group Meeting Stephen Dombroski – September 2011.

JUST IN TIME. Just in Time Getting the right quantity of goods at the right place at the right time.

Operations Management BA 301 – Spring 2003 Just-in-Time Systems Supplement 12.

Billy Brown, Bridget Lawson, Dev Shah, Jason Smeak, and Craig Taylor

JIT and Lean Operations

1 Chapter 16 Just-In-Time Systems. 2 JIT/Lean Production Just-in-time: Repetitive production system in which processing and movement of materials and.
About project
© 2024 SlidePlayer.com Inc. All rights reserved.
Academia.edu no longer supports Internet Explorer.
To browse Academia.edu and the wider internet faster and more securely, please take a few seconds to upgrade your browser .
Enter the email address you signed up with and we'll email you a reset link.
- We're Hiring!
- Help Center

Case Analysis, Toyota: "The Lean Mind" 70 Years of innovation

This case study aims to reveal the reasons for Toyota's success and make its experience guide the developing brands to success.
Related Papers
helen turner
Long Range Planning
Peter J. Buckley
Mossimo Sesom
Deborah Nightingale
This Transition-To-Lean Guide is intended to help your enterprise leadership navigate your enterprise’s challenging journey into the promising world of “lean.” You have opened this guide because, in some fashion, you have come to realize that your enterprise must undertake a fundamental transformation in how it sees the world, what it values, and the principles that will become its guiding lights if it is to prosper — or even survive — in this new era of “clock-speed” competition. However you may have been introduced to “lean,” you have undertaken to benefit from its implementation.
Ayesha Majid , Yahya Rehman
Toyota is a name almost everyone is familiar with. It has been the market leader in automobiles specially hybrid and electric automobiles. It has been operational in Pakistan since 1989. Toyota is a one of a kind Japanese multinational automotive manufacturer. As of September 2018, it was the sixth largest company in the world in terms of revenue. The economic conditions however have not been very favorable for the automotive industry. The economy of Pakistan and the consistent increase in dollar rates has taken a huge toll on the sales of the multinational manufacturer. Focus group analysis show that majority of the people preferred Honda over Toyota due to several reasons including near to none change in the designs of Toyota Corolla’s variants. Another factor was that Toyota was seen more as a car for the rural areas which was best suited for a rugged terrain. Although the general perception is that Toyota has better car suspension and fuel efficiency, people would still prefer Honda and other Japanese cars. Respondents said that advertisements played a crucial role but they do not compel the customer to buy a product like a car, there are other factors that are taken under consideration. Pakwheels and olx were the first two online platforms that they mentioned when asked about their go to online source. Family and friends advice played a major role in deciding which car to buy. According to the research conducted by our group through questionnaire, a regression was done and seen that the general perception that a reduction in prices will increase sales was not true because people usually associate low prices with low quality products. According to the regression, only advertisement and product have a significant result. All the variables are positively correlated with each other and less than one and positive indicating a formative relationship to the dependent variable. Branding has an insignificant positive relationship with purchase intention because consumers are only considering three competitors; Honda, Suzuki and Japanese cars.
Volume III of this guide may be used as an in-depth reference source for acquiring deep knowledge about many of the aspects of transitioning to lean. Lean change agents and lean implementation leaders should find this volume especially valuable in preparing their organizations for the lean transformation and in developing and implementing an enterprise level lean implementation plan. The richness and depth of the discussions in this volume should be helpful in charting a course, avoiding pitfalls, and making in-course corrections during implementation. We assume that the reader of Volume III is familiar with the history and general principles of the lean paradigm that are presented in Volume I, Executive Overview. A review of Volume II, Transition to Lean Roadmap may be helpful prior to launching into Volume III. For those readers most heavily involved in the lean transformation, all three volumes should be understood and referenced frequently.
Loading Preview
Sorry, preview is currently unavailable. You can download the paper by clicking the button above.
- We're Hiring!
- Help Center
- Find new research papers in:
- Health Sciences
- Earth Sciences
- Cognitive Science
- Mathematics
- Computer Science
- Academia ©2024
Implementation of Total Quality Management (TQM): Toyota Case Study
- To find inspiration for your paper and overcome writer’s block
- As a source of information (ensure proper referencing)
- As a template for you assignment
Introduction
Implementation of tqm in toyota, tqm practices in toyota, benefits of tqm in toyota, examples of tqm in toyota, toyota quality management, toyota tqm implementation challenges.
The Toyota Corporation case study report is based on the implementation of total quality management (TQM) meant to improve the overall performance and operations of this automobile company. TQM involves the application of quality management standards to all elements of the business.
It requires that quality management standards be applied in all branches and at all levels of the organization. The characteristic of Toyota Corporation going through the total quality process is unambiguous and clear.
Toyota has limited interdepartmental barriers, excellent customer and supplier relations, spares time to be spent on training, and the recognition that quality is realized through offering excellent products as well as the quality of the entire firm, including personnel, finance, sales, and other functions.
The top management at Toyota Corporation has the responsibility for quality rather than the employees, and it is their role to provide commitment, support, and leadership to the human and technical processes (Kanji & Asher, 1996).
Whereas the TQM initiative is to succeed, the management has to foster the participation of Toyota Corporation workers in quality improvement and create a quality culture by altering attitudes and perceptions towards quality.
This research report assesses the implementation of TQM and how Toyota manages quality in all organization management systems while focusing on manufacturing quality. The report evaluates the organization management elements required when implementing TQM, identifies, and investigates the challenges facing Quality Managers or Executives in implementing Quality Management Systems.
In order to implement TQM, Toyota corporations focused on the following phases:
- The company extended the management responsibility past the instantaneous services and products
- Toyota examined how consumers applied the products generated, and this enabled the company to develop and improve its commodities
- Toyota focused on the insubstantial impacts on the procedures as well as how such effects could be minimized through optimization
- Toyota focused on the kaizen (incessant process development) in order to ensure that all procedures are measurable, repeatable, and visible.
The commitment from business executives is one of the key TQM implementation principles that make an organization successful. In fact, the organizational commitment present in the senior organizational staff ranges from top to lower administration. These occur through self-driven motives, motivation, and employee empowerment. Total Quality Management becomes achievable at Toyota by setting up the mission and vision statements, objectives, and organizational goals.
In addition, the TQM is achievable via the course of active participation in organizational follow-up actions. These actions denote the entire activities needed and involved during the implementation of the set-out ideologies of the organization. From Toyota Corporation’s report, TQM has been successful through the commitment of executive management and the organizational workforce (Toyota Motor Corporation, 2012).
Through inventory and half the bottlenecks at half cost and time, the adopters of TMS (Toyota Management System) are authorized to manufacture twice above the normal production. To manage the quality in all organizational management systems, the Toyota Production System incorporates different modernisms like strategy or Hoshin Kanri use, overall value supervision, and just-in-time assembly.
The amalgamation of these innovations enables Toyota to have a strong competitive advantage despite the fact that Toyota never originated from all of them. The 1914 Henry Ford invention relied on the just-in-time production model. The Ford system of production, from a grand perspective, warrants massive production, thus quality (Toyota Motor Corporation, 2012).
Kanji and Asher (1996) claim that to manage the minute set of production necessitated by the splintered and small post-war marketplaces, the JIT system focuses on the motion and elimination of waste materials. This reduces crave for work-in-process inventory by wrapping up the long production lines. Toyota Corp wraps the production lines into slashed change-over times, a multi-trained workforce that runs manifold machines, and new-fangled cells into a U shape.
When supplementing the just-in-cells, the system of kanban is employed by the Toyota Corporation to connect the cells that are unable to integrate physically. Equally, the system helps Toyota integrate with other external companies, consumers, and suppliers.
The TQM and the creativity of Toyota proprietors both support the quality at the source. The rectification and discovery of the production problems require the executives to be committed. At the forefront of Toyota operations, the managers integrate a number of forms of operational quality checks to ensure quality management at all levels.
The uninterrupted tests help the Toyota workforce engaging in the assembly course to scrutinize the value of apparatus, implements, and resources utilized in fabrication. The checks help in the scrutiny of the previously performed tasks by other workers. However, the corporation’s own test enables the workers to revise their personal advances in the assembly course.
The Toyota process owners set up the mistake-proofing (Poka-yoke) procedures and devices to capture the awareness of management and involuntarily correct and surface the augmenting problems. This is essential for the critical production circumstances and steps that prove impractical and tricky for Toyota employees to inspect.
Nevertheless, the policy deployment system decentralizes the process of decision-making at Toyota. This context of implementing Total Quality Management originates from Hoshin Kanri’s management by objective (MBO).
This aspect becomes more advantageous to Toyota when dealing with quality management. The system initially puts into practice the coordinated approach and provides a clear structure for the suppliers, producers, and consumers through inter-organizational cost administration. Moreover, Toyota executives can solve the concurrent delivery, cost, and quality bottlenecks, thus replacing and increasing the relatively slow accounting management mechanisms.
Customer focus that leads to the desired customer satisfaction at Toyota Company is one of the major success factors in TQM implementation. For every business to grow, it should have understanding, reliable, and trustworthy customers. The principle of customer satisfaction and focus has been the most presently well-thought-out aspect of Toyota’s manufacturing quality.
The TQM may characteristically involve total business focus towards meeting and exceeding customers’ expectations and requirements by considering their personal interests. The mission of improving and achieving customer satisfaction ought to stream from customer focus.
Thus, when focusing on manufacturing quality, this aspect enhances TQM implementation. The first priorities at Toyota are community satisfaction, employees, owners, consumers, and mission. The diverse consumer-related features from liberty. The concern to care is eminent in Toyota Corporation during manufacturing.
Toyota has three basic perspectives of TQM that are customer-oriented. These are based on its manufacturing process traced back to the 1950s. The strategies towards achieving quality manufacturing, planning, and having a culture towards quality accomplishment are paramount for TQM implementation to remain successful. To enhance and maintain quality through strategic planning schemes, all managers and employers must remain effectively driven.
This involves training workers on principles concerning quality culture and achievement. Scheduling and planning are analytical applications at Toyota Company that purposes in assessing customer demand, material availability, and plant capacity during manufacturing.
The Toyota Corporation has considerable approaches that rank it among the successful and renowned implementers of TQM. From the inherent and designed structure of Toyota, it becomes feasible to comprehend why quality manufacturing is gradually becoming effective. The inspection department is responsible for taking corrective measures, salvaging, and sorting the desired manufactured product or service quality.
The Toyota Corporation also has a quality control system that is involved in determining quality policies, reviewing statistics, and establishing quality manuals or presentation data. Furthermore, quality assurance is one of the integral principles in quality implementation that is practically present at Toyota. The quality assurance and quality inspectors throughout the Toyota Company structure also manage research and development concerning the quality of manufactured products and services.

The Toyota production and operations management system is similarly dubbed as the managerial system. In fact, in this corporation, operational management is also referred to as the production process, production management, or operations (Chary, 2009). These simply incorporate the actual production and delivery of products.
The managerial system involves product design and the associated product process, planning and implementing production, as well as acquiring and organizing resources. With this broad scope, the production and operation managers have a fundamental role to play in the company’s ability to reach the TQM implementation goals and objectives.
The Toyota Corporation operations managers are required to be conversant and familiar with the TQM implementation concepts and issues that surround this functional area. Toyota’s operation management system is focused on fulfilling the requirements of the customers.
The corporation realizes this by offering loyal and express commodities at logical fees and assisting dealers in progressing commodities proffered. As Slack et al. (2009) observed, the basic performance objectives, which pertain to all the Toyota’s operations, include quality, speed, flexibility, dependability, and cost. Toyota Company has been successful in meeting these objectives through its production and operation functions.
Over several decades, Toyota’s operational processes and management systems were streamlined, resulting in the popularly known Toyota Production System. Although the system had been extensively researched, many companies, such as Nissan, experienced difficulties in replicating TPS.
The TPS was conceived when the company realized that producing massive quantities from limited product lines and ensuring large components to achieve maximum economies of scale led to flaws. Its major objectives were to reduce cost, eliminate waste, and respond to the changing needs of the customers. The initial feature of this system was set-up time reduction, and this forms the basis of TQM implementation.
At Toyota Corporation, quality is considered as acting responsibly through the provision of blunder-gratis products that please the target clientele. Toyota vehicles are among the leading brands in customer satisfaction. Due to good quality, its success has kept growing, and in 2012, the company was the best worldwide. Moreover, Toyota has been keen on producing quality vehicles via the utilization of various technologies that improve the performance of the vehicles.
While implementing TQM, Toyota perceives speed as a key element. In this case, speed objective means doing things fast in order to reduce the time spent between ordering and availing the product to the customer.
The TPS method during processing concentrates on reducing intricacy via the use of minute and uncomplicated machinery that is elastic and full-bodied. The company’s human resources and managers are fond of reorganizing streams and designs to promote minimalism. This enhances the speed of production.
Another objective during TQM implementation is dependability. This means timely working to ensure that customers get their products within the promised time. Toyota has included a just-in-time production system comprised of multi-skilled employees who work in teams. The kanban control allows the workers to deliver goods and services as promised. Advancing value and effectiveness appears to be the distress for administrators, mechanical specialists, and other Toyota human resources.
During TQM implementation, Toyota responds to the demands by changing its products and the way of doing business. Chary (2009) argues that while implementing TQM, organizations must learn to like change and develop responsive and flexible organizations to deal with the changing business environment.
Within Toyota plants, this incorporates the ability to adopt the manufacturing resources to develop new models. The company is able to attain an elevated degree of suppleness, manufacturing fairly tiny bunches of products devoid of losses in excellence or output.
The organizational hierarchy and job descriptions also determine the successful implementation of the TQM. Toyota is amongst the few companies whose organizational structure and task allocation have proved viable in TQM implementation. The company has three levels of management. See the diagram below.
Management hierarchy
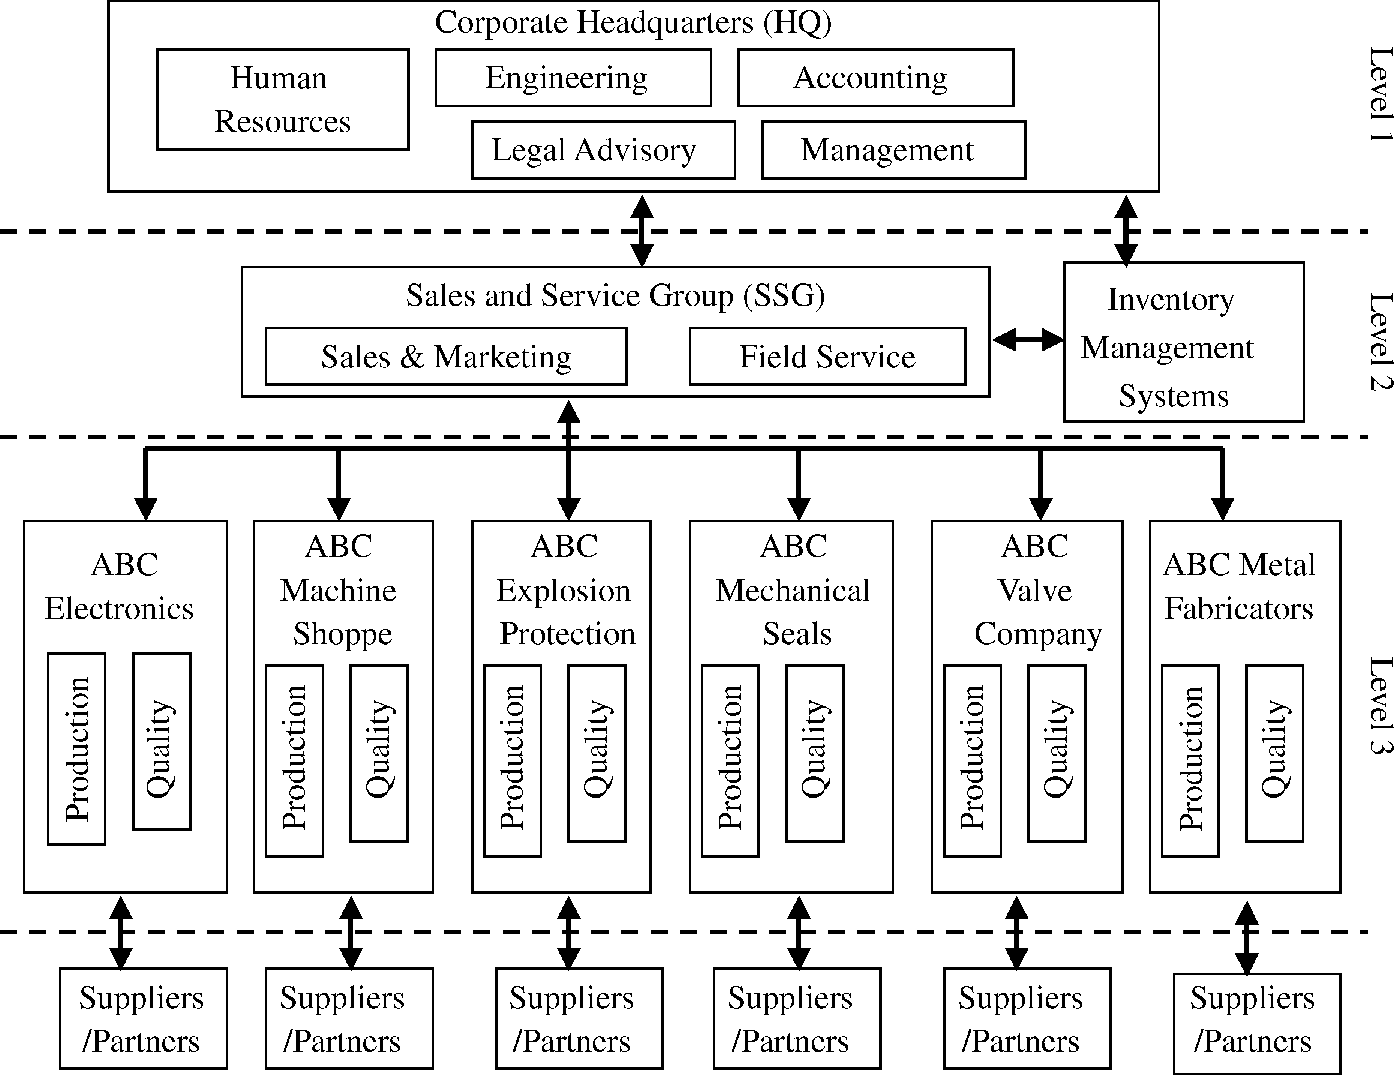
Despite the hierarchy and task specification, employees are able to make independent decisions and take corrective measures when necessary to ensure quality during production. Team working is highly encouraged at Toyota Corporation, and this plays a significant role during TQM implementation. All stakeholders are incorporated in quality control initiatives to ensure client demands are satisfied.
However, all employees are required to carry out their assigned tasks, and the management closely supervises the ways of interactions between workers. The management ensures that the manufacturing lines are well-built and all employees are motivated to learn how to improve the production processes.
Toyota is among the few manufacturers in the complete automobile industry that consistently profited during the oil crisis in 1974. The discovery was the unique team working of the Japanese that utilized scientific management rules (Huczynski & Buchanan, 2007).
The joint effort in Japan, usually dubbed Toyotaism, is a kind of job association emphasizing ‘lean-assembly.’ The technique merges just-in-time production, dilemma-answering groups, job equivalence, authoritative foremost-streak administration, and continued procedure perfection.
Just-in-time (JIT) assembly scheme attempts to accomplish all clients’ needs instantly, devoid of misuse but with ideal excellence. JIT appears to be dissimilar from the conventional functional performances in that it emphasizes speedy production and ravage purging that adds to stumpy supply.
Control and planning of many JIT approaches are concerned directly with pull scheduling, leveled scheduling, kanban control, synchronization of flow, and mixed-model scheduling (Slack et al., 2009).
Toyota appears to be amongst the principal participants in changing Japan to a kingpin in car production. Companies, which have adopted the company’s production system, have increased efficiency and productivity. The 2009 industrial survey of manufacturers indicates that many world-class firms have adopted continuous-flow or just-in-time production and many techniques Toyota has been developing many years ago.
In addition, the manufacturing examination of top plant victors illustrates that the mainstream them utilize lean production techniques widely. Thus, team-working TPS assists Toyota Corporation in the implementation of TQM.
Executives and Quality Managers face some challenges while implementing Quality Management Systems in organizations. In fact, with a lack of the implementation resources such as monetary and human resources in any organization, the implementation of TQM cannot be successful. Towards the implementation of programs and projects in organizations, financial and human resources have become the pillar stones.
The approach of TQM impels marketplace competence from all kinds of organizational proceeds to ensure profitability and productivity. To meet the desired results in TQM implementation, an organization ought to consider the availability of human and financial resources that are very important for the provision of an appropriate milieu for accomplishing organizational objectives.
In the case of Toyota, which originated and perfected the philosophy of TQM, the Executives, and Quality Managers met some intertwined problems during TQM implementation. The flaw in the new product development is increasingly becoming complicated for the managers to break and accelerate, thus creating reliability problems. Besides, secretive culture and dysfunctional organizational structure cause barriers in communication between the top management, thus, in turn, augmenting public outrage.
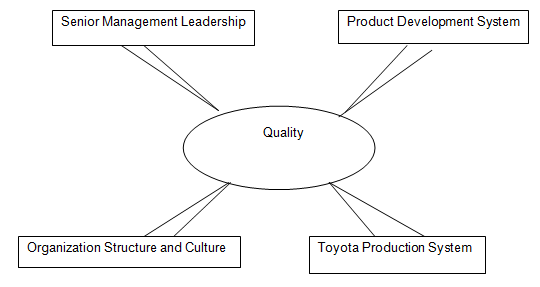
The top executives may fail to provide and scale up adequate training to the suppliers and new workforces. As a result, cracks are created in the rigorous TPS system. In addition, a lack of leadership at the top management might cause challenges in the implementation of TQM. Therefore, in designing the organizational structures and systems that impact quality, the senior executives and managers must be responsible, as elaborated in Figure 2 below.
Total Quality Management is a concept applied in the automobile industry, including the Toyota Corporation. It focuses on continuous improvement across all branches and levels of an organization. Being part of Toyota, the concept defines the way in which the organization can create value for its customers and other stakeholders. Through TQM, Toyota Corporation has been able to create value, which eventually leads to operation efficiencies.
These efficiencies have particularly been achieved by continuous correction of deficiencies identified in the process. A particular interest is the central role that information flow and management have played in enabling TQM initiatives to be implemented, especially through continuous learning and team working culture.
The Toyota way (kaizen), which aims at integrating the workforce suggestions while eliminating overproduction and manufacturing wastes, helps the company to respect all the stakeholders and give clients first priority. The objectives are realized through TPS.
Chary, D. 2009, Production and operations management , Tata McGraw-Hill Education Press, Mumbai.
Huczynski, A. & Buchanan, D. 2007, Organizational behavior; an introductory text, Prentice Hall, New York, NY.
Kanji, G. K. & Asher, M. 1996, 100 methods for total quality management , SAGE Thousands Oak, CA.
Slack, N. et al. 2009, Operations and process management: principles and practice for strategic management, Prentice Hall, New York, NY.
Toyota Motor Corporation 2012, Annual report 2012. Web.
- Google Corporation Investments Evaluation
- How HR Approaches Match Up With the Strategic Initiatives
- Motorola Company's Just-in-Time Implementation
- Toyota Motor Corporation's Sustainability
- Lean Manufacturing: Processes
- Barriers and Facilitators of Workplace Learning
- The Science of Behavior in Business
- Standards, models, and quality: Management
- Managerial and Professional Development: Crowe Horwath CPA limited
- Managerial and Professional Development: Deloitte & Touché Company
- Chicago (A-D)
- Chicago (N-B)
IvyPanda. (2019, June 12). Implementation of Total Quality Management (TQM): Toyota Case Study. https://ivypanda.com/essays/total-quality-management-tqm-implementation-toyota/
"Implementation of Total Quality Management (TQM): Toyota Case Study." IvyPanda , 12 June 2019, ivypanda.com/essays/total-quality-management-tqm-implementation-toyota/.
IvyPanda . (2019) 'Implementation of Total Quality Management (TQM): Toyota Case Study'. 12 June.
IvyPanda . 2019. "Implementation of Total Quality Management (TQM): Toyota Case Study." June 12, 2019. https://ivypanda.com/essays/total-quality-management-tqm-implementation-toyota/.
1. IvyPanda . "Implementation of Total Quality Management (TQM): Toyota Case Study." June 12, 2019. https://ivypanda.com/essays/total-quality-management-tqm-implementation-toyota/.
Bibliography
IvyPanda . "Implementation of Total Quality Management (TQM): Toyota Case Study." June 12, 2019. https://ivypanda.com/essays/total-quality-management-tqm-implementation-toyota/.
Newly Launched - AI Presentation Maker

- Toyota Motor Corporation
- Popular Categories
AI PPT Maker
Powerpoint Templates
Icon Bundle
Kpi Dashboard
Professional
Business Plans
Swot Analysis
Gantt Chart
Business Proposal
Marketing Plan
Project Management
Business Case
Business Model
Cyber Security
Business PPT
Digital Marketing
Digital Transformation
Human Resources
Product Management
Artificial Intelligence
Company Profile
Acknowledgement PPT
PPT Presentation
Reports Brochures
One Page Pitch
Interview PPT
All Categories
Powerpoint Templates and Google slides for Toyota Motor Corporation
Save your time and attract your audience with our fully editable ppt templates and slides..
Item 1 to 60 of 68 total items
- You're currently reading page 1

This report is an extensively researched profile on company Toyota Motor Corporation Company Profile Overview Financials And Statistics From 2014 to 2018 in industry Consumer Goods And FMCG and Retail and Trade and E-Commerce and has been prepared by SlideTeam industry experts after extensively researching through hundreds of data sources. This is part of our Company Profiles products selection, and you will need a Paid account to download the actual report with accurate data and sources for each statistic and fact. Downloaded report will be in Powerpoint and will contain the actual editable slides with the actual data and sources for each data where applicable. Download it immediately and use it for your business.
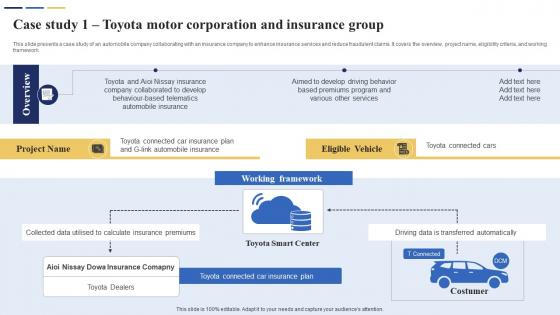
This slide presents a case study of an automobile company collaborating with an insurance company to enhance insurance services and reduce fraudulent claims. It covers the overview, project name, eligibility criteria, and working framework. Increase audience engagement and knowledge by dispensing information using Case Study 1 Toyota Motor Corporation And Insurance Role Of IoT In Revolutionizing Insurance IoT SS. This template helps you present information on two stages. You can also present information on Project Name, Eligible Vehicle using this PPT design. This layout is completely editable so personaize it now to meet your audiences expectations.

The purpose of this slide is to explore Toyota motor corporations lean manufacturing success. It highlights transformative strategies that optimize efficiency, quality, and competitive advantage. Introducing our Case Study Toyota Motor Corporations Lean Manufacturing Success Ppt Sample set of slides. The topics discussed in these slides are Objective, Strategies, Effect. This is an immediately available PowerPoint presentation that can be conveniently customized. Download it and convince your audience.

The information presented in this slide has been researched by our team of professional business analysts. This is part of our Company Profiles products selection, and you will need a Paid account to download the actual report with accurate data and sources. Downloaded report will be in Powerpoint and will contain the actual editable slides with the actual data and sources for each data. This slide shows the environmental challenges to overcome by Toyota Motor Corporation in 2050. Download it immediately and use it for your business.
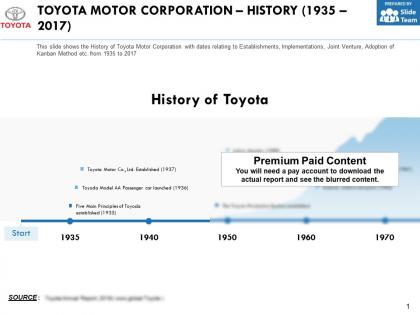
The information presented in this slide has been researched by our team of professional business analysts. This is part of our Company Profiles products selection, and you will need a Paid account to download the actual report with accurate data and sources. Downloaded report will be in Powerpoint and will contain the actual editable slides with the actual data and sources for each data. This slide shows the History of Toyota Motor Corporation with dates relating to Establishments, Implementations, Joint Venture, Adoption of Kanban Method etc. from 1935 to 2017. Download it immediately and use it for your business.
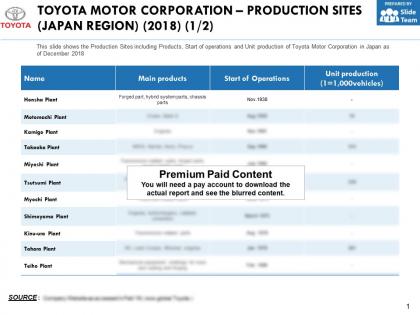
The information presented in this slide has been researched by our team of professional business analysts. This is part of our Company Profiles products selection, and you will need a Paid account to download the actual report with accurate data and sources. Downloaded report will be in Powerpoint and will contain the actual editable slides with the actual data and sources for each data. This slide shows the Production Sites including Products, Start of operations and Unit production of Toyota Motor Corporation in Japan as of December 2018. Download it immediately and use it for your business.
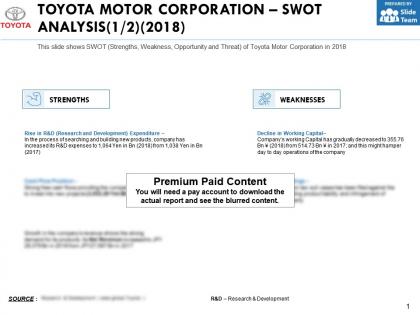
The information presented in this slide has been researched by our team of professional business analysts. This is part of our Company Profiles products selection, and you will need a Paid account to download the actual report with accurate data and sources. Downloaded report will be in Powerpoint and will contain the actual editable slides with the actual data and sources for each data. This slide shows SWOT Strengths, Weakness, Opportunity and Threat of Toyota Motor Corporation in 2018. Download it immediately and use it for your business.
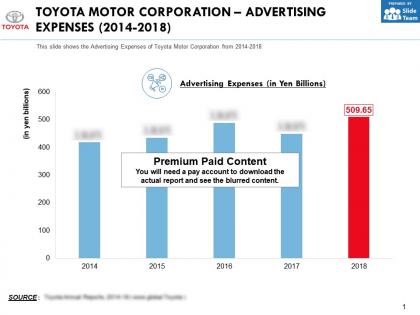
This is a professionally designed visual chart for Toyota Motor Corporation Advertising Expenses 2014 to 2018. This is part of our Data and Statistics products selection, and you will need a Paid account to download the actual report with accurate data and sources. Downloaded report will contain the editable graph with accurate data, an excel table with the actual data, the exact source of the data and the release date. This slide shows the Advertising Expenses of Toyota Motor Corporation from 2014 to 2018. Download it immediately and use it for your business.
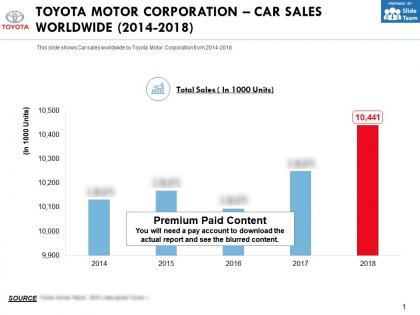
This is a professionally designed visual chart for Toyota Motor Corporation Car Sales Worldwide 2014 to 2018. This is part of our Data and Statistics products selection, and you will need a Paid account to download the actual report with accurate data and sources. Downloaded report will contain the editable graph with accurate data, an excel table with the actual data, the exact source of the data and the release date. This slide shows Car sales worldwide by Toyota Motor Corporation from 2014 to 2018. Download it immediately and use it for your business.
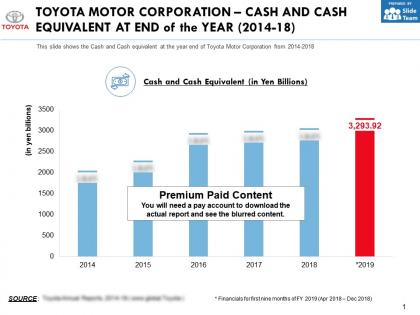
This is a professionally designed visual chart for Toyota Motor Corporation Cash And Cash Equivalent At End Of The Year 2014 to 18. This is part of our Data and Statistics products selection, and you will need a Paid account to download the actual report with accurate data and sources. Downloaded report will contain the editable graph with accurate data, an excel table with the actual data, the exact source of the data and the release date. This slide shows the Cash and Cash equivalent at the year end of Toyota Motor Corporation from 2014 to 2018. Download it immediately and use it for your business.
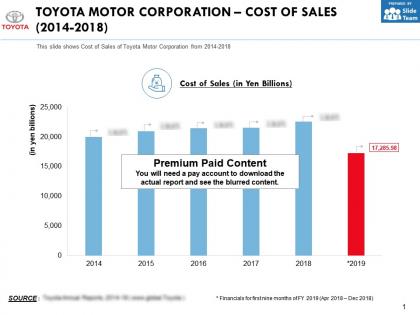
This is a professionally designed visual chart for Toyota Motor Corporation Cost Of Sales 2014 to 2018. This is part of our Data and Statistics products selection, and you will need a Paid account to download the actual report with accurate data and sources. Downloaded report will contain the editable graph with accurate data, an excel table with the actual data, the exact source of the data and the release date. This slide shows Cost of Sales of Toyota Motor Corporation from 2014 to 2018. Download it immediately and use it for your business.
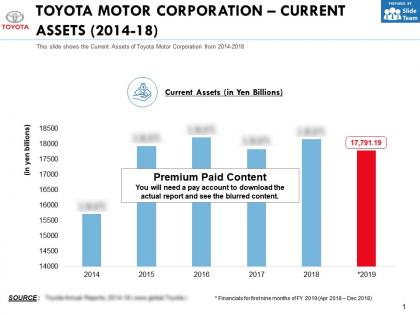
This is a professionally designed visual chart for Toyota Motor Corporation Current Assets 2014 to 18. This is part of our Data and Statistics products selection, and you will need a Paid account to download the actual report with accurate data and sources. Downloaded report will contain the editable graph with accurate data, an excel table with the actual data, the exact source of the data and the release date. This slide shows the Current Assets of Toyota Motor Corporation from 2014 to 2018. Download it immediately and use it for your business.
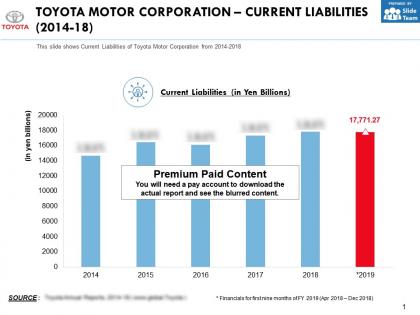
This is a professionally designed visual chart for Toyota Motor Corporation Current Liabilities 2014 to 18. This is part of our Data and Statistics products selection, and you will need a Paid account to download the actual report with accurate data and sources. Downloaded report will contain the editable graph with accurate data, an excel table with the actual data, the exact source of the data and the release date. This slide shows Current Liabilities of Toyota Motor Corporation from 2014 to 2018 . Download it immediately and use it for your business.
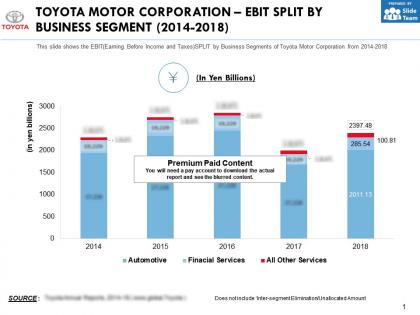
This is a professionally designed visual chart for Toyota Motor Corporation Ebit Split By Business Segment 2014 to 2018. This is part of our Data and Statistics products selection, and you will need a Paid account to download the actual report with accurate data and sources. Downloaded report will contain the editable graph with accurate data, an excel table with the actual data, the exact source of the data and the release date. This slide shows the EBIT Earning Before Income and Taxes SPLIT by Business Segments of Toyota Motor Corporation from 2014 to 2018. Download it immediately and use it for your business.

This is a professionally designed visual chart for Toyota Motor Corporation Employee Breakup By Regions 2014 to 18. This is part of our Data and Statistics products selection, and you will need a Paid account to download the actual report with accurate data and sources. Downloaded report will contain the editable graph with accurate data, an excel table with the actual data, the exact source of the data and the release date. This slide shows Toyota Motor Corporation Employee Breakup by Regions from the years 2014 to 2018. Download it immediately and use it for your business.
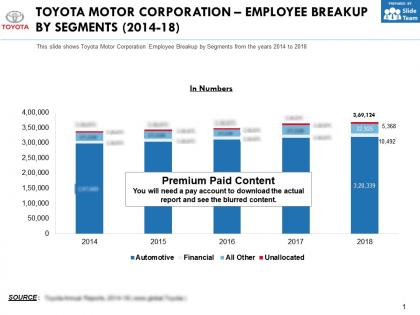
This is a professionally designed visual chart for Toyota Motor Corporation Employee Breakup By Segments 2014 to 18. This is part of our Data and Statistics products selection, and you will need a Paid account to download the actual report with accurate data and sources. Downloaded report will contain the editable graph with accurate data, an excel table with the actual data, the exact source of the data and the release date. This slide shows Toyota Motor Corporation Employee Breakup by Segments from the years 2014 to 2018. Download it immediately and use it for your business.
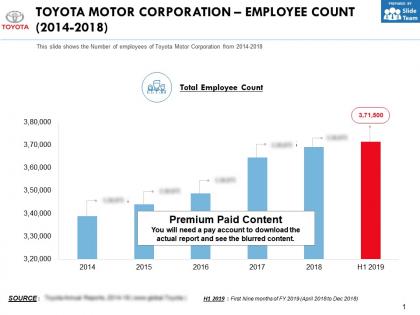
This is a professionally designed visual chart for Toyota Motor Corporation Employee Count 2014 to 2018. This is part of our Data and Statistics products selection, and you will need a Paid account to download the actual report with accurate data and sources. Downloaded report will contain the editable graph with accurate data, an excel table with the actual data, the exact source of the data and the release date. This slide shows the Number of employees of Toyota Motor Corporation from 2014 to 2018. Download it immediately and use it for your business.

This is a professionally designed visual chart for Toyota Motor Corporation Enterprise Value 2014 to 18. This is part of our Data and Statistics products selection, and you will need a Paid account to download the actual report with accurate data and sources. Downloaded report will contain the editable graph with accurate data, an excel table with the actual data, the exact source of the data and the release date. This slide shows the enterprise value of Toyota Motor Corporation from the years 2014 to 2018. Download it immediately and use it for your business.
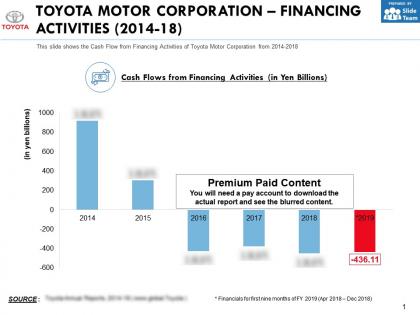
This is a professionally designed visual chart for Toyota Motor Corporation Financing Activities 2014 to 18. This is part of our Data and Statistics products selection, and you will need a Paid account to download the actual report with accurate data and sources. Downloaded report will contain the editable graph with accurate data, an excel table with the actual data, the exact source of the data and the release date. This slide shows the Cash Flow from Financing Activities of Toyota Motor Corporation from 2014 to 2018. Download it immediately and use it for your business.
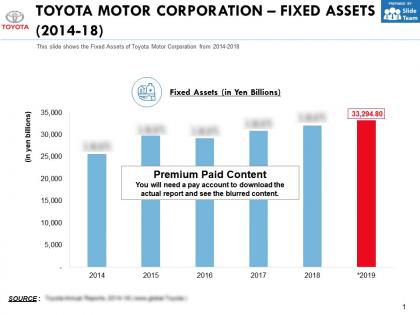
This is a professionally designed visual chart for Toyota Motor Corporation Fixed Assets 2014 to 18. This is part of our Data and Statistics products selection, and you will need a Paid account to download the actual report with accurate data and sources. Downloaded report will contain the editable graph with accurate data, an excel table with the actual data, the exact source of the data and the release date. This slide shows the Fixed Assets of Toyota Motor Corporation from 2014 to 2018. Download it immediately and use it for your business.
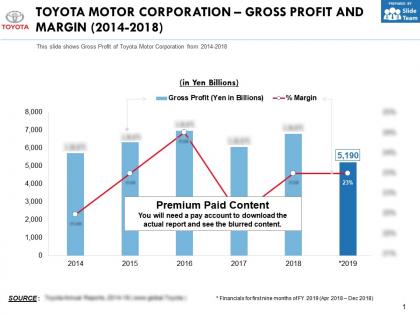
This is a professionally designed visual chart for Toyota Motor Corporation Gross Profit And Margin 2014 to 2018. This is part of our Data and Statistics products selection, and you will need a Paid account to download the actual report with accurate data and sources. Downloaded report will contain the editable graph with accurate data, an excel table with the actual data, the exact source of the data and the release date. This slide shows Gross Profit of Toyota Motor Corporation from 2014 to 2018. Download it immediately and use it for your business.
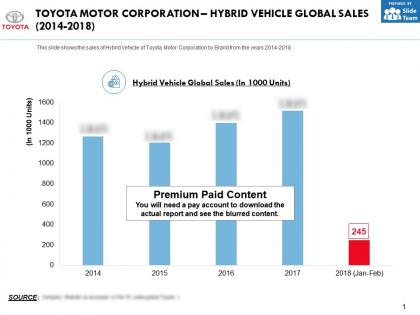
This is a professionally designed visual chart for Toyota Motor Corporation Hybrid Vehicle Global Sales 2014 to 2018. This is part of our Data and Statistics products selection, and you will need a Paid account to download the actual report with accurate data and sources. Downloaded report will contain the editable graph with accurate data, an excel table with the actual data, the exact source of the data and the release date. This slide shows the sales of Hybrid Vehicle of Toyota Motor Corporation by Brand from the years 2014 to 2018. Download it immediately and use it for your business.
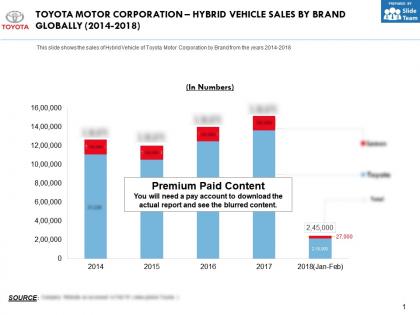
This is a professionally designed visual chart for Toyota Motor Corporation Hybrid Vehicle Sales By Brand Globally 2014 to 2018. This is part of our Data and Statistics products selection, and you will need a Paid account to download the actual report with accurate data and sources. Downloaded report will contain the editable graph with accurate data, an excel table with the actual data, the exact source of the data and the release date. This slide shows the sales of Hybrid Vehicle of Toyota Motor Corporation by Brand from the years 2014 to 2018. Download it immediately and use it for your business.
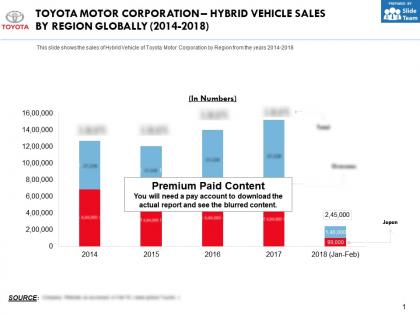
This is a professionally designed visual chart for Toyota Motor Corporation Hybrid Vehicle Sales By Region Globally 2014 to 2018. This is part of our Data and Statistics products selection, and you will need a Paid account to download the actual report with accurate data and sources. Downloaded report will contain the editable graph with accurate data, an excel table with the actual data, the exact source of the data and the release date. This slide shows the sales of Hybrid Vehicle of Toyota Motor Corporation by Region from the years 2014 to 2018. Download it immediately and use it for your business.

This is a professionally designed visual chart for Toyota Motor Corporation Investing Activities 2014 to 18. This is part of our Data and Statistics products selection, and you will need a Paid account to download the actual report with accurate data and sources. Downloaded report will contain the editable graph with accurate data, an excel table with the actual data, the exact source of the data and the release date. This slide shows the Cash Flows from Investing activities of Toyota Motor Corporation from 2014 to 2018. Download it immediately and use it for your business.

This is a professionally designed visual chart for Toyota Motor Corporation Investments In PPE 2014 to 18. This is part of our Data and Statistics products selection, and you will need a Paid account to download the actual report with accurate data and sources. Downloaded report will contain the editable graph with accurate data, an excel table with the actual data, the exact source of the data and the release date. This slide shows the Investments in Property, Plant and Equipment of Toyota Motor Corporation from 2014 to 2018. Download it immediately and use it for your business.
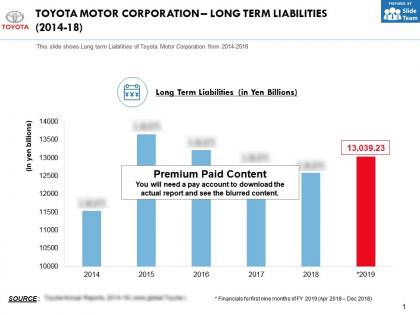
This is a professionally designed visual chart for Toyota Motor Corporation Long Term Liabilities 2014 to 18. This is part of our Data and Statistics products selection, and you will need a Paid account to download the actual report with accurate data and sources. Downloaded report will contain the editable graph with accurate data, an excel table with the actual data, the exact source of the data and the release date. This slide shows Long term Liabilities of Toyota Motor Corporation from 2014 to 2018. Download it immediately and use it for your business.
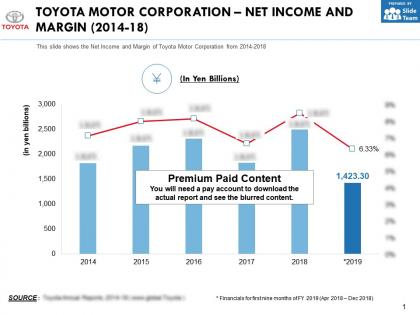
This is a professionally designed visual chart for Toyota Motor Corporation Net Income And Margin 2014 to 18. This is part of our Data and Statistics products selection, and you will need a Paid account to download the actual report with accurate data and sources. Downloaded report will contain the editable graph with accurate data, an excel table with the actual data, the exact source of the data and the release date. This slide shows the Net Income and Margin of Toyota Motor Corporation from 2014 to 2018. Download it immediately and use it for your business.
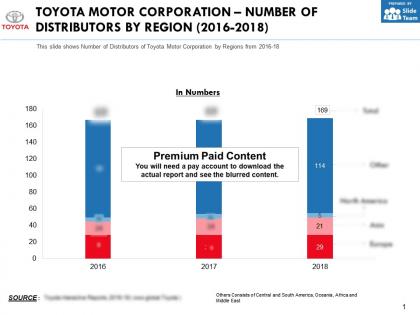
This is a professionally designed visual chart for Toyota Motor Corporation Number Of Distributors By Region 2016 to 2018. This is part of our Data and Statistics products selection, and you will need a Paid account to download the actual report with accurate data and sources. Downloaded report will contain the editable graph with accurate data, an excel table with the actual data, the exact source of the data and the release date. This slide shows Number of Distributors of Toyota Motor Corporation by Regions from 2016 to 18. Download it immediately and use it for your business.
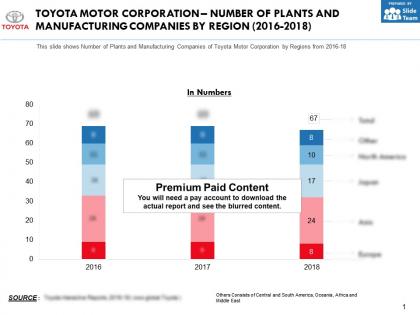
This is a professionally designed visual chart for Toyota Motor Corporation Number Of Plants And Manufacturing Companies By Region 2016 to 2018. This is part of our Data and Statistics products selection, and you will need a Paid account to download the actual report with accurate data and sources. Downloaded report will contain the editable graph with accurate data, an excel table with the actual data, the exact source of the data and the release date. This slide shows Number of Plants and Manufacturing Companies of Toyota Motor Corporation by Regions from 2016 to 18. Download it immediately and use it for your business.
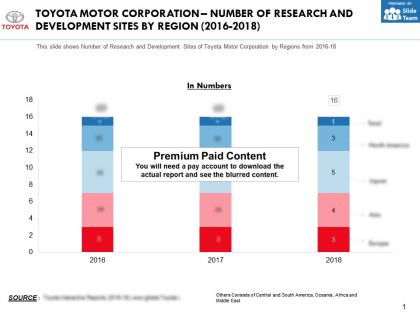
This is a professionally designed visual chart for Toyota Motor Corporation Number Of Research And Development Sites By Region 2016 to 2018. This is part of our Data and Statistics products selection, and you will need a Paid account to download the actual report with accurate data and sources. Downloaded report will contain the editable graph with accurate data, an excel table with the actual data, the exact source of the data and the release date. This slide shows Number of Research and Development Sites of Toyota Motor Corporation by Regions from 2016 to 18. Download it immediately and use it for your business.
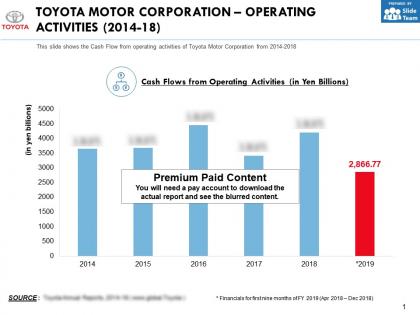
This is a professionally designed visual chart for Toyota Motor Corporation Operating Activities 2014 to 18. This is part of our Data and Statistics products selection, and you will need a Paid account to download the actual report with accurate data and sources. Downloaded report will contain the editable graph with accurate data, an excel table with the actual data, the exact source of the data and the release date. This slide shows the Cash Flow from operating activities of Toyota Motor Corporation from 2014 to 2018. Download it immediately and use it for your business.

This is a professionally designed visual chart for Toyota Motor Corporation Operating Income And Margin 2014 to 2018. This is part of our Data and Statistics products selection, and you will need a Paid account to download the actual report with accurate data and sources. Downloaded report will contain the editable graph with accurate data, an excel table with the actual data, the exact source of the data and the release date. This slide shows the Operating Income and Margin of Toyota Motor Corporation from 2014 to 2018. Download it immediately and use it for your business.
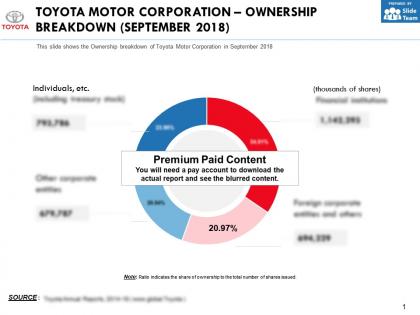
This is a professionally designed visual chart for Toyota Motor Corporation Ownership Breakdown September 2018. This is part of our Data and Statistics products selection, and you will need a Paid account to download the actual report with accurate data and sources. Downloaded report will contain the editable graph with accurate data, an excel table with the actual data, the exact source of the data and the release date. This slide shows the Ownership breakdown of Toyota Motor Corporation in September 2018. Download it immediately and use it for your business.
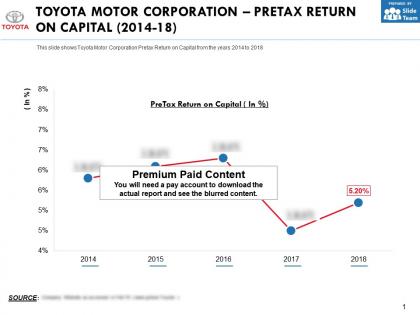
This is a professionally designed visual chart for Toyota Motor Corporation Pretax Return On Capital 2014 to 18. This is part of our Data and Statistics products selection, and you will need a Paid account to download the actual report with accurate data and sources. Downloaded report will contain the editable graph with accurate data, an excel table with the actual data, the exact source of the data and the release date. This slide shows Toyota Motor Corporation Pretax Return on Capital from the years 2014 to 2018. Download it immediately and use it for your business.
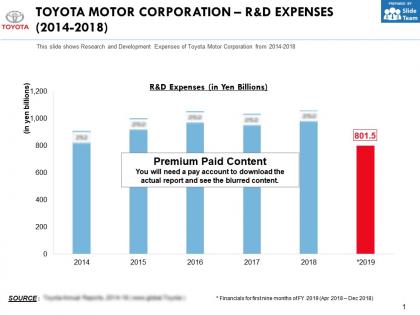
This is a professionally designed visual chart for Toyota Motor Corporation R And D Expenses 2014 to 2018. This is part of our Data and Statistics products selection, and you will need a Paid account to download the actual report with accurate data and sources. Downloaded report will contain the editable graph with accurate data, an excel table with the actual data, the exact source of the data and the release date. This slide shows Research and Development Expenses of Toyota Motor Corporation from 2014 to 2018. Download it immediately and use it for your business.
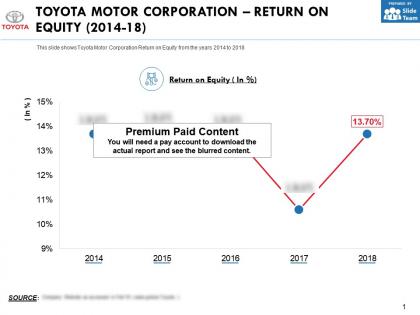
This is a professionally designed visual chart for Toyota Motor Corporation Return On Equity 2014 to 18. This is part of our Data and Statistics products selection, and you will need a Paid account to download the actual report with accurate data and sources. Downloaded report will contain the editable graph with accurate data, an excel table with the actual data, the exact source of the data and the release date. This slide shows Toyota Motor Corporation Return on Equity from the years 2014 to 2018. Download it immediately and use it for your business.
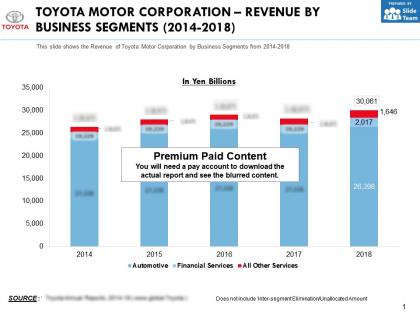
This is a professionally designed visual chart for Toyota Motor Corporation Revenue By Business Segments 2014 to 2018. This is part of our Data and Statistics products selection, and you will need a Paid account to download the actual report with accurate data and sources. Downloaded report will contain the editable graph with accurate data, an excel table with the actual data, the exact source of the data and the release date. This slide shows the Revenue of Toyota Motor Corporation by Business Segments from 2014 to 2018. Download it immediately and use it for your business.
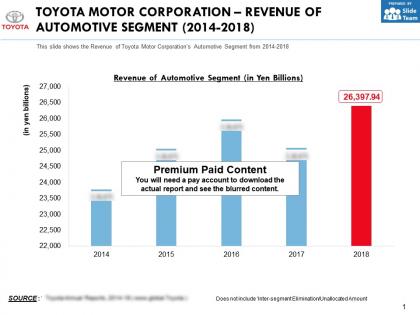
This is a professionally designed visual chart for Toyota Motor Corporation Revenue Of Automotive Segment 2014 to 2018. This is part of our Data and Statistics products selection, and you will need a Paid account to download the actual report with accurate data and sources. Downloaded report will contain the editable graph with accurate data, an excel table with the actual data, the exact source of the data and the release date. This slide shows the Revenue of Toyota Motor Corporations Automotive Segment from 2014 to 2018. Download it immediately and use it for your business.
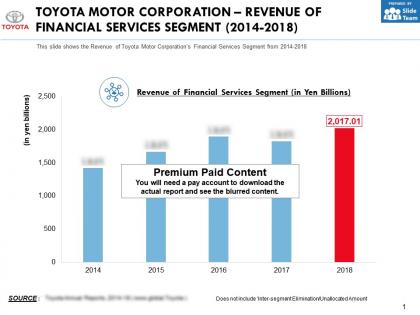
This is a professionally designed visual chart for Toyota Motor Corporation Revenue Of Financial Services Segment 2014 to 2018. This is part of our Data and Statistics products selection, and you will need a Paid account to download the actual report with accurate data and sources. Downloaded report will contain the editable graph with accurate data, an excel table with the actual data, the exact source of the data and the release date. This slide shows the Revenue of Toyota Motor Corporations Financial Services Segment from 2014 to 2018. Download it immediately and use it for your business.
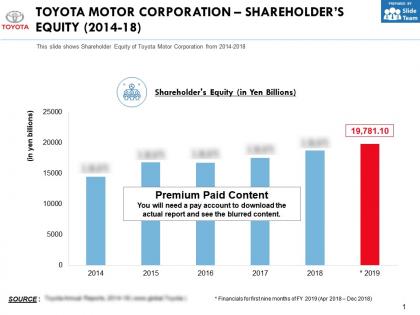
This is a professionally designed visual chart for Toyota Motor Corporation Shareholders Equity 2014 to 18. This is part of our Data and Statistics products selection, and you will need a Paid account to download the actual report with accurate data and sources. Downloaded report will contain the editable graph with accurate data, an excel table with the actual data, the exact source of the data and the release date. This slide shows Shareholder Equity of Toyota Motor Corporation from 2014 to 2018. Download it immediately and use it for your business.
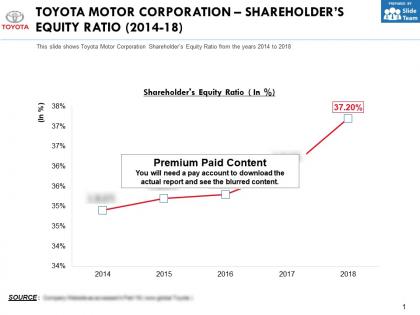
This is a professionally designed visual chart for Toyota Motor Corporation Shareholders Equity Ratio 2014 to 18. This is part of our Data and Statistics products selection, and you will need a Paid account to download the actual report with accurate data and sources. Downloaded report will contain the editable graph with accurate data, an excel table with the actual data, the exact source of the data and the release date. This slide shows Toyota Motor Corporation Shareholders Equity Ratio from the years 2014 to 2018. Download it immediately and use it for your business.
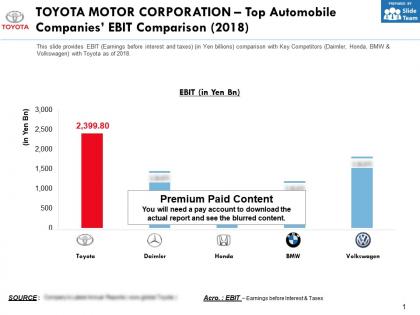
This is a professionally designed visual chart for Toyota Motor Corporation Top Automobile Companies Ebit Comparison 2018. This is part of our Data and Statistics products selection, and you will need a Paid account to download the actual report with accurate data and sources. Downloaded report will contain the editable graph with accurate data, an excel table with the actual data, the exact source of the data and the release date. This slide provides EBIT Earnings before interest and taxes in Yen billions comparison with Key Competitors Daimler, Honda, BMW and Volkswagen with Toyota as of 2018. Download it immediately and use it for your business.
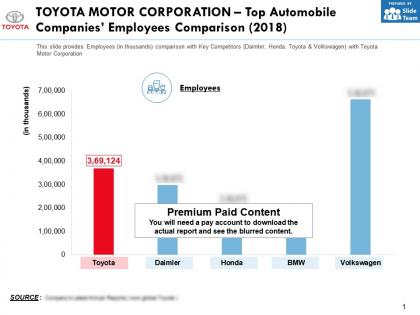
This is a professionally designed visual chart for Toyota Motor Corporation Top Automobile Companies Employees Comparison 2018. This is part of our Data and Statistics products selection, and you will need a Paid account to download the actual report with accurate data and sources. Downloaded report will contain the editable graph with accurate data, an excel table with the actual data, the exact source of the data and the release date. This slide provides Employees in thousands comparison with Key Competitors Daimler, Honda, Toyota and Volkswagen with Toyota Motor Corporation. Download it immediately and use it for your business.
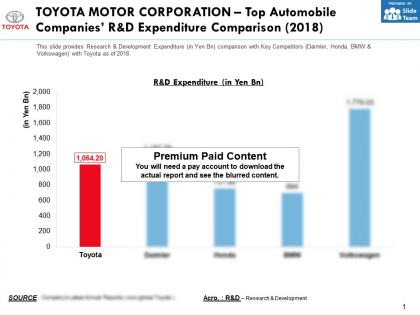
This is a professionally designed visual chart for Toyota Motor Corporation Top Automobile Companies R And D Expenditure Comparison 2018. This is part of our Data and Statistics products selection, and you will need a Paid account to download the actual report with accurate data and sources. Downloaded report will contain the editable graph with accurate data, an excel table with the actual data, the exact source of the data and the release date. This slide provides Research and Development Expenditure in Yen Bn comparison with Key Competitors Daimler, Honda, BMW and Volkswagen with Toyota as of 2018. Download it immediately and use it for your business.
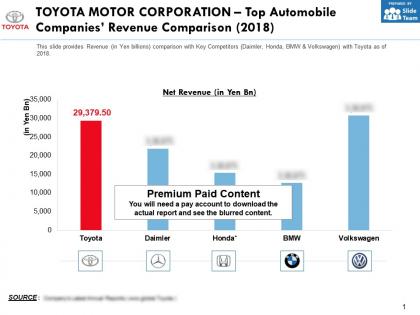
This is a professionally designed visual chart for Toyota Motor Corporation Top Automobile Companies Revenue Comparison 2018. This is part of our Data and Statistics products selection, and you will need a Paid account to download the actual report with accurate data and sources. Downloaded report will contain the editable graph with accurate data, an excel table with the actual data, the exact source of the data and the release date. This slide provides Revenue in Yen billions comparison with Key Competitors Daimler, Honda, BMW and Volkswagen with Toyota as of 2018. Download it immediately and use it for your business.
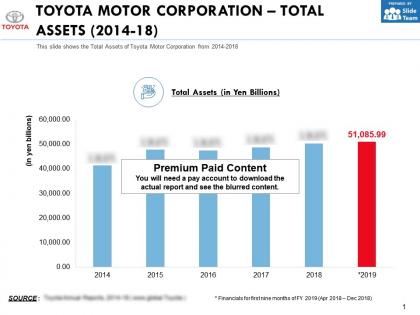
This is a professionally designed visual chart forToyota Motor Corporation Total Assets 2014 to 18. This is part of our Data and Statistics products selection, and you will need a Paid account to download the actual report with accurate data and sources. Downloaded report will contain the editable graph with accurate data, an excel table with the actual data, the exact source of the data and the release date. This slide shows the Total Assets of Toyota Motor Corporation from 2014 to 2018. Download it immediately and use it for your business.
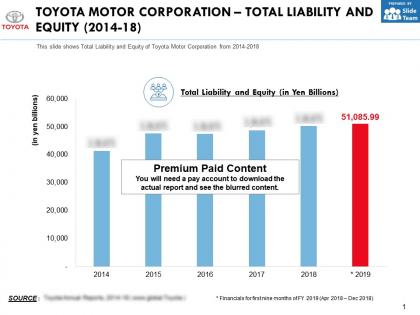
This is a professionally designed visual chart for Toyota Motor Corporation Total Liability And Equity 2014 to 18. This is part of our Data and Statistics products selection, and you will need a Paid account to download the actual report with accurate data and sources. Downloaded report will contain the editable graph with accurate data, an excel table with the actual data, the exact source of the data and the release date. This slide shows Total Liability and Equity of Toyota Motor Corporation from 2014 to 2018. Download it immediately and use it for your business.
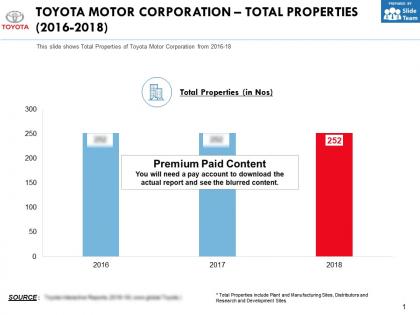
This is a professionally designed visual chart for Toyota Motor Corporation Total Properties 2016 to 2018. This is part of our Data and Statistics products selection, and you will need a Paid account to download the actual report with accurate data and sources. Downloaded report will contain the editable graph with accurate data, an excel table with the actual data, the exact source of the data and the release date. This slide shows Total Properties of Toyota Motor Corporation from 2016 to 18. Download it immediately and use it for your business.
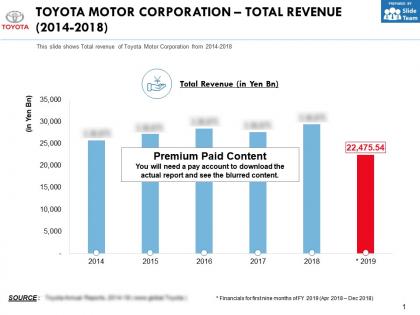
This is a professionally designed visual chart for Toyota Motor Corporation Total Revenue 2014 to 2018. This is part of our Data and Statistics products selection, and you will need a Paid account to download the actual report with accurate data and sources. Downloaded report will contain the editable graph with accurate data, an excel table with the actual data, the exact source of the data and the release date. This slide shows Total revenue of Toyota Motor Corporation from 2014 to 2018. Download it immediately and use it for your business.
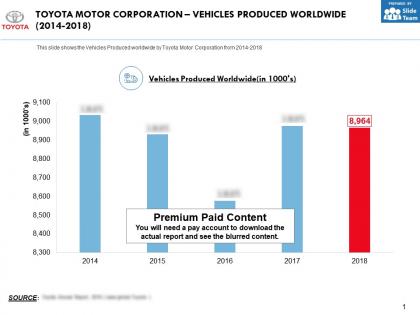
This is a professionally designed visual chart for Toyota Motor Corporation Vehicles Produced Worldwide 2014 to 2018. This is part of our Data and Statistics products selection, and you will need a Paid account to download the actual report with accurate data and sources. Downloaded report will contain the editable graph with accurate data, an excel table with the actual data, the exact source of the data and the release date. This slide shows the Vehicles Produced worldwide by Toyota Motor Corporation from 2014 to 2018. Download it immediately and use it for your business.
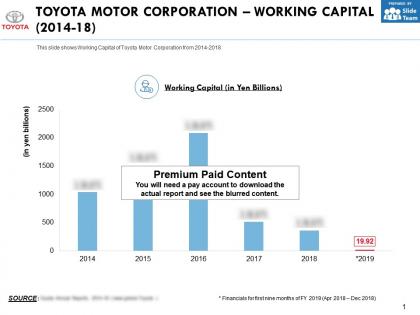
This is a professionally designed visual chart for Toyota Motor Corporation Working Capital 2014 to 18. This is part of our Data and Statistics products selection, and you will need a Paid account to download the actual report with accurate data and sources. Downloaded report will contain the editable graph with accurate data, an excel table with the actual data, the exact source of the data and the release date. This slide shows Working Capital of Toyota Motor Corporation from 2014 to 2018. Download it immediately and use it for your business.

This is a professionally designed visual chart for Toyota Motor Corporation Customer Satisfaction In U.S 2014 to 18. This is part of our Data and Statistics products selection, and you will need a Paid account to download the actual report with accurate data and sources. Downloaded report will contain the editable graph with accurate data, an excel table with the actual data, the exact source of the data and the release date. This slide shows Customer satisfaction Index score of Toyota Motor Corporation from 2014 to 2018. Download it immediately and use it for your business.
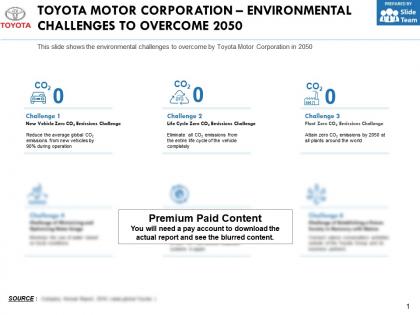
The information presented in this slide has been researched by our team of professional business analysts. This is part of our Company Profiles products selection, and you will need a Paid account to download the actual report with accurate data and sources. Downloaded report will be in Powerpoint and will contain the actual editable slides with the actual data and sources for each data. This slide shows the Global Vision of Toyota Motor Corporation for the year 2018. Download it immediately and use it for your business.
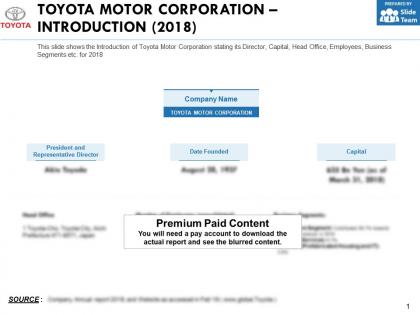
The information presented in this slide has been researched by our team of professional business analysts. This is part of our Company Profiles products selection, and you will need a Paid account to download the actual report with accurate data and sources. Downloaded report will be in Powerpoint and will contain the actual editable slides with the actual data and sources for each data. This slide shows the Introduction of Toyota Motor Corporation stating its Director, Capital, Head Office, Employees, Business Segments etc. for 2018. Download it immediately and use it for your business.
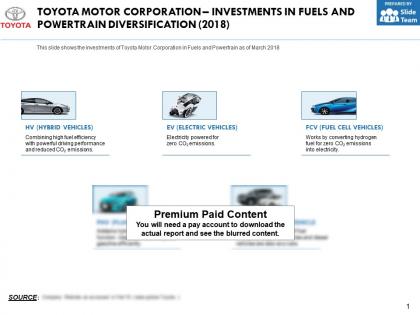
The information presented in this slide has been researched by our team of professional business analysts. This is part of our Company Profiles products selection, and you will need a Paid account to download the actual report with accurate data and sources. Downloaded report will be in Powerpoint and will contain the actual editable slides with the actual data and sources for each data. This slide shows the investments of Toyota Motor Corporation in Fuels and Powertrain as of March 2018. Download it immediately and use it for your business.
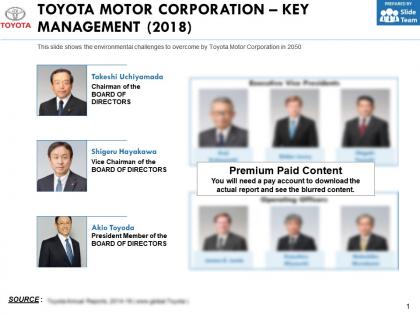
The information presented in this slide has been researched by our team of professional business analysts. This is part of our Company Profiles products selection, and you will need a Paid account to download the actual report with accurate data and sources. Downloaded report will be in Powerpoint and will contain the actual editable slides with the actual data and sources for each data. This slide shows the brief introduction about Toyota Motor Corporation such as founder, employees, revenue, market cap etc. for 2018. Download it immediately and use it for your business.
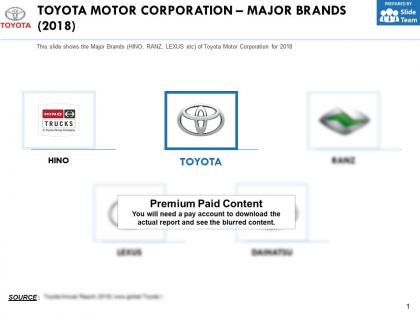
The information presented in this slide has been researched by our team of professional business analysts. This is part of our Company Profiles products selection, and you will need a Paid account to download the actual report with accurate data and sources. Downloaded report will be in Powerpoint and will contain the actual editable slides with the actual data and sources for each data. This slide shows the Major Brands HINO, RANZ, LEXUS etc. of Toyota Motor Corporation for 2018. Download it immediately and use it for your business.

- SUGGESTED TOPICS
- The Magazine
- Newsletters
- Managing Yourself
- Managing Teams
- Work-life Balance
- The Big Idea
- Data & Visuals
- Reading Lists
- Case Selections
- HBR Learning
- Topic Feeds
- Account Settings
- Email Preferences
Learning to Lead at Toyota
- Steven Spear
Toyota’s famous production system makes great cars—and with them great managers. Here’s how one American hotshot learned to replicate Toyota’s DNA.
Reprint: R0405E
Many companies have tried to copy Toyota’s famous production system—but without success. Why? Part of the reason, says the author, is that imitators fail to recognize the underlying principles of the Toyota Production System (TPS), focusing instead on specific tools and practices.
This article tells the other part of the story. Building on a previous HBR article, “Decoding the DNA of the Toyota Production System,” Spear explains how Toyota inculcates managers with TPS principles. He describes the training of a star recruit—a talented young American destined for a high-level position at one of Toyota’s U.S. plants. Rich in detail, the story offers four basic lessons for any company wishing to train its managers to apply Toyota’s system:
- There’s no substitute for direct observation. Toyota employees are encouraged to observe failures as they occur—for example, by sitting next to a machine on the assembly line and waiting and watching for any problems.
- Proposed changes should always be structured as experiments. Employees embed explicit and testable assumptions in the analysis of their work. That allows them to examine the gaps between predicted and actual results.
- Workers and managers should experiment as frequently as possible. The company teaches employees at all levels to achieve continuous improvement through quick, simple experiments rather than through lengthy, complex ones.
- Managers should coach, not fix. Toyota managers act as enablers, directing employees but not telling them where to find opportunities for improvements.
Rather than undergo a brief period of cursory walk-throughs, orientations, and introductions as incoming fast-track executives at most companies might, the executive in this story learned TPS the long, hard way—by practicing it, which is how Toyota trains any new employee, regardless of rank or function.
The Idea in Brief
Many companies try to emulate Toyota’s vaunted production system (TPS), which uses simple real-time experiments to continually improve operations. Yet few organizations garner the hoped-for successes Toyota consistently achieves: unmatched quality, reliability, and productivity; unparalleled cost reduction; sales and market share growth; and market capitalization.
Why the difficulty? Companies take the wrong approach to training leaders in TPS: They rely on cursory introductions to the system, such as plant walk-throughs and classroom orientation sessions. But to truly understand TPS, managers must live it—absorbing it the long, hard way through total immersion training .
The keys to total immersion training? Leadership trainees directly observe people and machines in action—watching for and addressing problems as they emerge. Through frequent, simple experiments—relocating a switch, adjusting computer coding—they test their hypotheses about which changes will create which consequences. And they receive coaching—not answers—from their supervisors.
Total immersion training takes time. No one can assimilate it in just a few weeks or months. But the results are well worth the wait: a cadre of managers who not only embody TPS but also can teach it to others.
The Idea in Practice
The keys to TPS total immersion training:
Direct Observation
Trainees watch employees work and machines operate, looking for visible problems. Example:
Bob Dallis, a talented manager hired for an upper-level position at one of Toyota’s U.S. engine plants, started his training by observing engine assemblers working. He spotted several problems. For example, as one worker loaded gears in a jig that he then put into a machine, he often inadvertently tripped the trigger switch before the jig was fully aligned, causing the apparatus to fault.
Changes Structured as Experiments
Learners articulate their hypotheses about changes’ potential impact, then use experiments to test their hypotheses. They explain gaps between predicted and actual results. Example:
During the first six weeks of his training, Dallis and his group of assembly workers proposed 75 changes—such as repositioning machine handles to reduce wrist strain—and implemented them over a weekend. Dallis and his orientation manager, Mike Takahashi, then spent the next week studying the assembly line to see whether the changes had the desired effects. They discovered that worker productivity and ergonomic safety had significantly improved.
Frequent Experimentation
Trainees are expected to make many quick, simple experiments instead of a few lengthy, complex ones. This generates ongoing feedback on their solutions’ effectiveness. They also work toward addressing increasingly complex problems through experimentation. This lets them make mistakes initially without severe consequences—which increases their subsequent willingness to take risks to solve bigger problems. Example:
During his first three days of training at a Japanese plant, Dallis was asked to simplify a production employee’s job by making 50 improvements—an average of one change every 22 minutes. At first Dallis was able to observe and alter obvious aspects of his workmate’s actions. By the third day, he was able to see the more subtle impact of a new production layout on the worker’s movements. Result? 50 problems identified—35 of which were fixed on the spot.
Managers as Coaches
Learners’ supervisors serve as coaches, not problem solvers. They teach trainees to observe and experiment. They also ask questions about proposed solutions and provide needed resources. Example:
Takahashi showed Dallis how to observe workers to spot instances of stress and wasted effort. But he never suggested actual process improvements. He also gave Dallis resources he needed to act quickly—such as the help of a worker who moved equipment and relocated wires so Dallis could test as many ideas as possible.
Toyota is one of the world’s most storied companies, drawing the attention of journalists, researchers, and executives seeking to benchmark its famous production system. For good reason: Toyota has repeatedly outperformed its competitors in quality, reliability, productivity, cost reduction, sales and market share growth, and market capitalization. By the end of last year it was on the verge of replacing DaimlerChrysler as the third-largest North American car company in terms of production, not just sales. In terms of global market share, it has recently overtaken Ford to become the second-largest carmaker. Its net income and market capitalization by the end of 2003 exceeded those of all its competitors. But those very achievements beg a question: If Toyota has been so widely studied and copied, why have so few companies been able to match its performance?
- SS Steven Spear is a senior lecturer at MIT’s Sloan School of Management and a senior fellow at the Institute for Healthcare Improvement.
Partner Center

- About / Contact
- Privacy Policy
- Alphabetical List of Companies
- Business Analysis Topics
Toyota’s Operations Management, 10 Critical Decisions, Productivity

Toyota Motor Corporation’s operations management (OM) covers the 10 decisions for effective and efficient operations. With the global scale of its automobile business and facilities around the world, the company uses a wide set of strategies for the 10 critical decisions of operations management. These strategies account for local and regional automotive market conditions, including the trends examined in the PESTLE analysis (PESTEL analysis) of Toyota . The automaker is an example of successful multinational operations management. These 10 decisions indicate the different areas of the business that require strategic approaches. Toyota also succeeds in emphasizing productivity in all the 10 decisions of operations management.
Toyota’s approaches for the 10 strategic decisions of operations management show the importance of coordinated efforts for ensuring streamlined operations and high productivity in international business. Successful operations management leads to high productivity, which supports competitive advantages over other automakers, such as Ford , General Motors , Tesla , BMW , and Hyundai. Nonetheless, these competitors continuously enhance their operations and create challenges to Toyota’s competitive advantages.
Toyota’s Operations Management, 10 Critical Decision Areas
1. Design of Goods and Services . Toyota addresses this strategic decision area of operations management through technological advancement and quality. The company uses its R&D investments to ensure advanced features in its products. Toyota’s mission statement and vision statement provide a basis for the types and characteristics of these products. Moreover, the automaker accounts for the needs and qualities of dealership personnel in designing after-sales services. Despite its limited influence on dealership employment, Toyota’s policies and guidelines ensure the alignment between dealerships and this area of the company’s operations management.
2. Quality Management . To maximize quality, the company uses its Toyota Production System (TPS). Quality is one of the key factors in TPS. Also, the firm addresses this strategic decision area of operations management through continuous improvement, which is covered in The Toyota Way, a set of management principles. These principles and TPS lead to high-quality processes and outputs, which enable innovation capabilities and other strengths shown in the SWOT analysis of Toyota . In this regard, quality is a critical success factor in the automotive company’s operations.
3. Process and Capacity Design . For this strategic decision area of operations management, Toyota uses lean manufacturing, which is also embodied in TPS. The company emphasizes waste minimization to maximize process efficiency and capacity utilization. Lean manufacturing helps minimize costs and supports business growth, which are objectives of Toyota’s generic strategy for competitive advantage and intensive strategies for growth . Thus, the car manufacturer supports business efficiency and cost-effectiveness in its process and capacity design. Cost-effective processes support the competitive selling prices that the company uses for most of its automobiles.
4. Location Strategy . Toyota uses global, regional, and local location strategies. For example, the company has dealerships and localized manufacturing plants in the United States, China, Thailand, and other countries. The firm also has regional facilities and offices. Toyota’s marketing mix (4Ps) influences the preferred locations for dealerships. The automaker addresses this strategic decision area of operations management through a mixed set of strategies.
5. Layout Design and Strategy . Layout design in Toyota’s manufacturing plants highlights the application of lean manufacturing principles. In this critical decision area, the company’s operations managers aim for maximum efficiency of workflow. On the other hand, dealership layout design satisfies the company’s standards but also includes decisions from dealership personnel.
6. Job Design and Human Resources . The company applies The Toyota Way and TPS for this strategic decision area of operations management. The firm emphasizes respect for all people in The Toyota Way, and this is integrated in HR programs and policies. These programs and policies align with Toyota’s organizational culture (business culture) . Also, the company has training programs based on TPS to ensure lean manufacturing practice. Moreover, Toyota’s company structure (business structure) affects this area of operations management. For example, the types and characteristics of jobs are specific to the organizational division, which can have human resource requirements different from those of other divisions.
7. Supply Chain Management . Toyota applies lean manufacturing for supply chain management. In this strategic decision area of operations management, the company uses automation systems for real-time adjustments in supply chain activity. In this way, the automotive business minimizes the bullwhip effect in its supply chain. It is worth noting that this area of operations management is subject to the bargaining power of suppliers. Even though the Five Forces analysis of Toyota indicates that suppliers have limited power, this power can still affect the automotive company’s productivity and operational effectiveness.
8. Inventory Management . In addressing this strategic decision area of operations management, Toyota minimizes inventory levels through just-in-time inventory management. The aim is to minimize inventory size and its corresponding cost. This inventory management approach is covered in the guidelines of TPS.
9. Scheduling . Toyota follows lean manufacturing principles in its scheduling. The company’s goal for this critical decision area of operations management is to minimize operating costs. Cost-minimization is maintained through HR and resource scheduling that changes according to market conditions.
10. Maintenance . Toyota operates a network of strategically located facilities to support its global business. The company also has a global HR network that supports flexibility and business resilience. In this strategic decision area of operations management, the company uses the global extent of its automotive business reach to ensure optimal and stable productivity. Effective maintenance of assets and business processes optimizes efficiency for Toyota’s sustainability and related CSR and ESG goals .
Productivity at Toyota
Toyota’s operations management uses productivity measures or criteria based on business process, personnel, area of business, and other variables. Some of these productivity measures are as follows:
- Number of product units per time (manufacturing plant productivity)
- Revenues per dealership (dealership productivity)
- Number of batch cycles per time (supply chain productivity)
- Cannas, V. G., Ciano, M. P., Saltalamacchia, M., & Secchi, R. (2023). Artificial intelligence in supply chain and operations management: A multiple case study research. International Journal of Production Research , 1-28.
- Jin, T. (2023). Bridging reliability and operations management for superior system availability: Challenges and opportunities. Frontiers of Engineering Management , 1-15.
- Toyota Motor Corporation – Form 20-F .
- Toyota Motor Corporation – R&D Centers .
- Toyota Production System .
- U.S. Department of Commerce – International Trade Administration – Automotive Industry .
- Copyright by Panmore Institute - All rights reserved.
- This article may not be reproduced, distributed, or mirrored without written permission from Panmore Institute and its author/s.
- Educators, Researchers, and Students: You are permitted to quote or paraphrase parts of this article (not the entire article) for educational or research purposes, as long as the article is properly cited and referenced together with its URL/link.

IMAGES
VIDEO
COMMENTS
Presentation Transcript. Toyota: a case study. Background • Toyota Motor Company was founded in 1937 by the Toyoda family. • Business was relatively unsuccessful until Eiji Toyoda introduced the method of lean production after studying Ford's Rouge plant in Detroit in 1950. • This lean production method became known as the Toyota ...
Toyota case study presentation.pptx - Free download as Powerpoint Presentation (.ppt / .pptx), PDF File (.pdf), Text File (.txt) or view presentation slides online. Toyota is the 11th largest company in the world by revenue and the third largest automobile manufacturer. It was founded in 1937 and has since become a global leader in automobile manufacturing, producing over 200 million vehicles.
Download ppt "A CASE STUDY ON TOYOTA PRODUCTION SYSTEM". Company History: Toyota Motor Corporation was Japan's largest car company and the world's third largest by the year The company was producing almost five million units annually in the late 1990s and controlled 9.8 percent of the global market for automobiles.
Toyota Case Study - Free download as Powerpoint Presentation (.ppt / .pptx), PDF File (.pdf), Text File (.txt) or view presentation slides online. This document summarizes the origins, evolution, and current prospects of Toyota Motor Corporation. It discusses Toyota's founding in the 1920s, the challenges it faced after World War II with a small market and lack of capital, and how it developed ...
Toyota Case Study Presentation - Free download as Powerpoint Presentation (.ppt / .pptx), PDF File (.pdf), Text File (.txt) or view presentation slides online. Toyota has established a complex supplier network known as a keiretsu. The keiretsu model involves clusters of affiliated suppliers known as kankei-kaisha located close to Toyota's assembly plants, as well as independent suppliers ...
NCES 1. TOYOTA CORPORATE OVERVIEW:Founded in 1937, Toyota Motor Corporation is a Japanese company that engages in the design, manufacture, assembly, and sale of passenger cars, minivans, commercial vehicles, and related parts and accessories primarily in Ja. an, North America, Europe, and Asia. Current brands incl.
Fion Chan. Download Free PDF. View PDF. Toyota: "The Lean Mind" 70 Years of innovation Abstract fThis case study aims to reveal the reasons for Toyota's success and make its experience guide the developing brands to success. As a giant from motor production industry, What does it takes to make it to one of the leading motor company in the ...
BCP. usiness Continuity Planning)"OpenChain is an important project for Toyota and i. s global software ecosystem. By embracing open source software and best practices around compliance, Toyota is sharing information and contributing to the community so that standards. c Group, Toyota IP DivisionToyota also places a premium on accumulating ...
The Toyota Corporation case study report is based on the implementation of total quality management (TQM) meant to improve the overall performance and operations of this automobile company. TQM involves the application of quality management standards to all elements of the business. Get a custom report on Implementation of Total Quality ...
Toyota's Kaizen Experience Case - Free download as Powerpoint Presentation (.ppt / .pptx), PDF File (.pdf), Text File (.txt) or view presentation slides online. This document discusses how Toyota used Kaizen, or continuous improvement, to achieve operational efficiency and competitive advantage. Some key aspects of Toyota's Kaizen approach discussed include: 1) Kaizen involved all employees ...
The purpose of this slide is to explore case study of employee empowerment in Toyota lean manufacturing. It showcases how decentralized decision-making and continuous skill development drive innovation, efficiency, and quality. Presenting our set of slides with name Case Study Employee Empowerment In Toyota Lean Manufacturing Ppt Presentation.
Introducing our Case Study Toyota Motor Corporations Lean Manufacturing Success Ppt Sample set of slides. The topics discussed in these slides are Objective, Strategies, Effect. This is an immediately available PowerPoint presentation that can be conveniently customized. Download it and convince your audience.
He describes the training of a star recruit—a talented young American destined for a high-level position at one of Toyota's U.S. plants. Rich in detail, the story offers four basic lessons for ...
Toyota's approaches for the 10 strategic decisions of operations management show the importance of coordinated efforts for ensuring streamlined operations and high productivity in international business. Successful operations management leads to high productivity, which supports competitive advantages over other automakers, such as Ford ...
Toyota implemented total quality management (TQM) very successfully. Key aspects of Toyota's TQM approach included: 1) Applying quality management standards throughout the entire organization and across all departments and levels. 2) Focusing on continuous process improvement through kaizen to ensure all processes are measurable, repeatable, and visible. 3) Gaining a strong commitment to ...
TOYOTA CASE STUDY - Free download as Powerpoint Presentation (.ppt / .pptx), PDF File (.pdf), Text File (.txt) or view presentation slides online. The document discusses issues Toyota Motor Manufacturing (TMM) is facing with defective seats being produced by its supplier, Kentucky Foam Seat (KFS). KFS is not following Toyota Production System principles like Jidoka and is allowing defective ...